Pu·MA System 3D for Automated Organoid Assays, In Situ Sampling and In Situ Imaging
Introduction
3D cell models and organoids provide a better rep-resentation of in vivo tissue or organ function. For the last three decades, researchers have been perfecting the formation and maintenance of various 3D models for understanding both disease and normal physiology (1-3). Some of the limiting factors have been the ability to perform complex assays easily and quickly with these precious samples especially patient-derived material. Also, when manually performing drug treat-ments and assays in 96-well plates, one is limited by the number of readouts per sample. The manual treatment, staining, and processing of spheroids and organoids is typically labor-intensive and prone to disrup tion or loss of samples.
In this application note, we report the use of our mi-crofluidic-based Pu·MA® System to perform automated assays using 3D cell models. The spheroids in this study HeLa (cervical carcinoma line) and HepG2 (hepatocyte carcinoma line) were incubated with and without com-pounds for 24−48 hours in the Pu·MA System. After drug treatments, the spheroid media was collected for secreted factor analysis. The spheroids were then stained and imaged within the flowchips using a confocal microscope. Other cell viability measurements or downstream analysis can be performed.
Pu·MA System Workflow
Pu·MA System and flowchips have been designed for a streamlined workflow as shown in in Figure 1. This consists of:
- loading spheroids and reagents into the flow-chips
- placing the holder into the Pu·MA System (in-side the incubator)
- running assay protocols via an intuitive touch-screen interface
- analyzing the spheroids within the flowchip us-ing a confocal microscope
- sampling supernatant for downstream analysis
The system architecture and use of pneumatics to move fluids provides gas exchange to the sample chambers within the incubator environment.
The flowchip features include:
- a convenient multi-well plate format (384-well spacings SLAS/ANSI standard)
- standard spacing for use with multichannel pipettes or automated liquid dispense system
- up to 32 tests per plate
- optically clear bottoms for imaging with any fluorescence or confocal imaging system
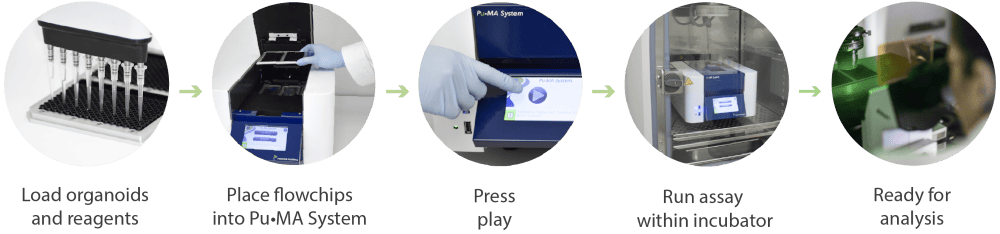
Figure 1. Schematic of the Pu·MA System workflow for automated organoid assays, in situ staining and imaging.
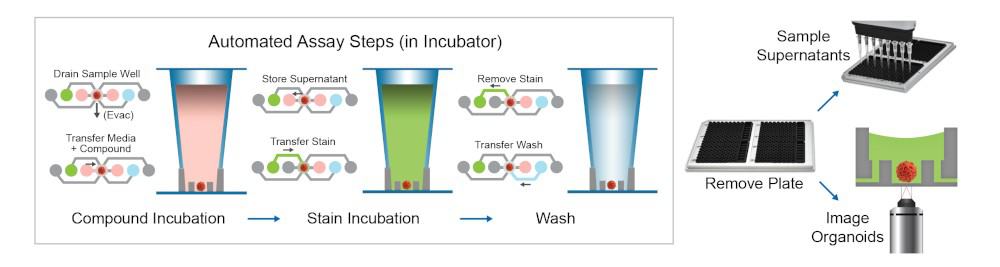
Figure 2. Schematic of assay steps for compound incubation, spheroid staining and downstream processing for imaging or supernatant sampling for secreted factor analysis.
In Situ Spheroid Imaging
An automated organoid assay protocol for staining of cancer spheroids was done using the Pu·MA System (schematic shown in Figure 2). Cultured HeLa cell spher-oids were stained for 2 hours in the flowchips within the Pu·MA System and then imaged within the flowchips us-ing an ImageXpress® Micro Confocal Imaging System (Molecular Devices, Sunnyvale, CA), as shown in Figure 3. Images were acquired using widefield or confocal aquisition as previously described (3), with a 10X Plan Fluor objective or 20X Plan Apo. A stack of 7-15 images separated by 10-15 μm was acquired, starting at the well bottom and covering approximately the lower half of each spheroid. Z-stack of images covered 100-200 μm for spheroids.
We show that the streamlined automated staining protocol combined with high-content imaging produced high quality confocal data. The spheroids imaged within the flowchips showed no compromise in image depth and quality.
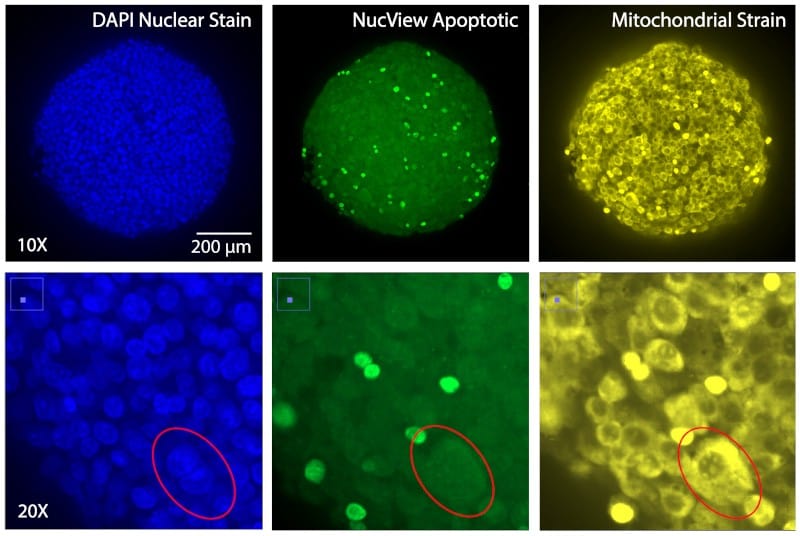 Figure 3. HeLa Spheroids stained and imaged within flow-chips for nuclear stain (Hoechst, Blue), apoptotic marker (NucView Green) and Mitochondrial marker for cell viability (Mitotracker™ Orange, Yellow).
Drug Treatment & Supernatant Sampling
To demonstrate the multi-readout capability of the Pu·MA System, two different cancer spheroids HeLa, and HepG2 cancer cells were assayed for cell viability and cell death in response to the effects of selected cytotoxic drug treatments. The assays were performed within the flowchips.
HeLa spheroids, control or individually treated with two different drugs valinomycin (1μM) or staurosporine (1μM) for 22 hours, were stained for 2 hours and then imaged within the flowchips. Images acquired are shown in Figure 4. Numbers of total, live, and dead cells for control and treated with valinomycin or staurosporine were determined from the image analysis data and shown in the bar graph.
Similarly, HepG2 spheroids, control or treated with different staurosporine concentrations (0−10 μM) for 44 hours, were stained for 2 hours imaged. Images acquired are shown in Figure 5. Cell numbers were plotted for live versus dead cells for different staurosporine concentrations (0.1 μM−10 μM).
The media from the HepG2 spheroids treated with staurosporine was collected during the assay for subsequent secreted factor analysis. Changes in spheroid function was assessed by Vascular Endothelial Growth Factor (VEGF) levels measured in the collected media using ELISA. This showed good correlation to the effect of the staurosporine treatment. (Figure 5C).
These applications demonstrate the Pu·MA System can:
- perform automated reagent, media and staining solution exchanges
- be used for measuring phenotypic changes within the flowchips in physiologically relevant conditions
- be used for multi-readout analysis, in this case staining, supernatant sampling and drug treatment changes
- combine with automated high content imaging in a streamlined workflow
- help achieve high quality images and data
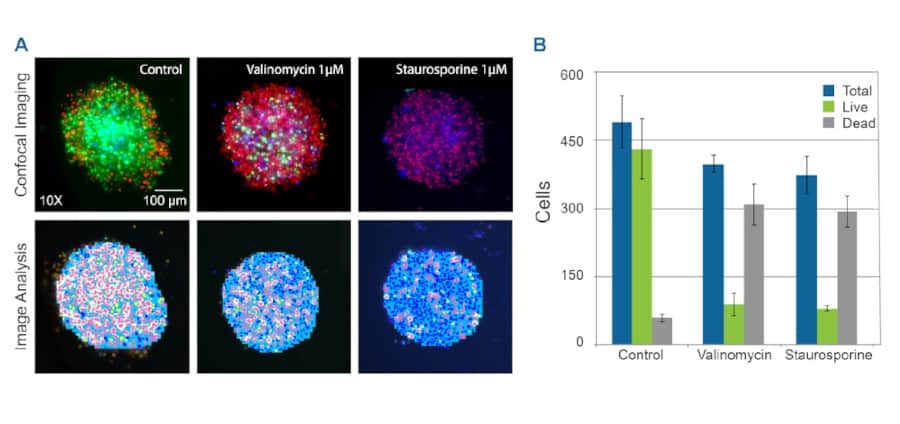
Figure 4. Toxicity analysis with HeLa spheroids. A Confocal image HeLa Cells control and treated (either Valinomycin or Staurosporine) samples. Control and treated HeLa spheroids, stained with nuclear stain (Hoechst, Blue), cell viability stain (Calcein AM, Green), apoptotic stain (Ethidium Homodimer 1, Red) and imaged within the flowchips. The panels below show detailed image analysis of the spheroids as observed within the flowchip. Image analysis was performed either in 3D or using the 2D Projection (MaxPro) image of confocal image stacks. B Bar graph indicating numbers of total, live or dead cells upon treatment with Valinomycin 1μM or Staurosporine 1μM.
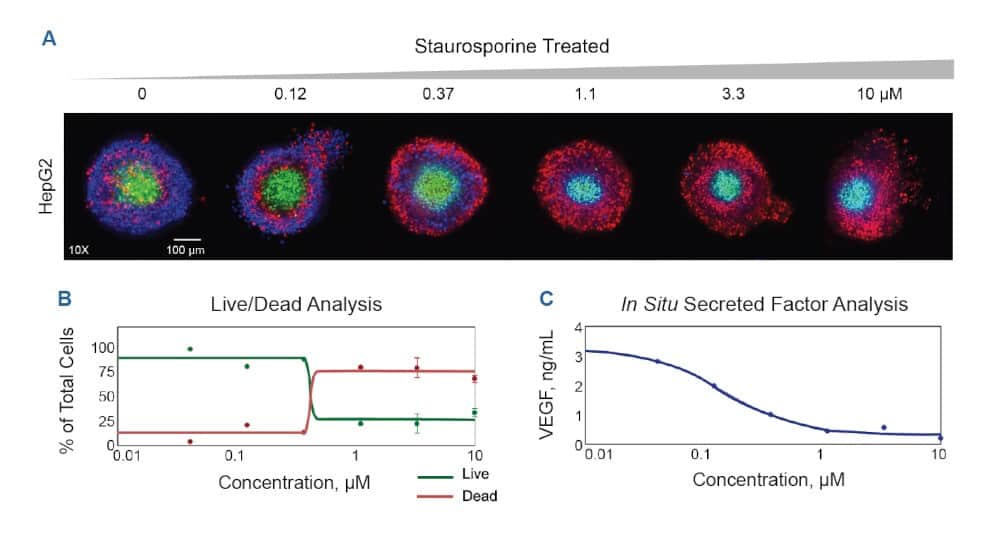
Figure 5. Toxicity analysis with HepG2 spheroids. A Confocal imaging of HepG2 spheroids treated with increasing concentrations of Staurosporine (0 to 10 μM) and stained with nuclear stain (Hoechst, Blue), cell viability dye (Calcein AM, Green), cell death stain (Ethidium Homodimer 1, Red). B Graph indicating percentage cell number live versus dead cells upon treatment different Staurosporine concentrations (0.01 μM−10 μM). C In situ secreted factor analysis was done by measuring VEGF levels from the media sampled after spheroid incubation with Staurosporine treatment (0.01 μM−10 μM). VEGF levels in the media collected was measured by ELISA.
Summary
In this application note we have demonstrated capabilities of the Pu·MA System 3D to perform:
- automated organoid / spheroid processing
- in situ sampling for secreted factor(s) analysis
- in situ staining and imaging within flowchips
- multiple readouts from a single sample
Using streamlined workflows and Pu·MA System protocols, we showed staining and imaging of two different 3D cell models in response to different drugs and drug concentrations. We showed that with increasing concentration of drug treatments we could quantify phenotypic changes in the cells, such as changes in cell death and in secreted factors all within physiologically relevant conditions with minimum perturbation to the samples.
References
- Schutgens, F. and H. Clevers, Human Organoids: Tools for Understanding Biology and Treating Diseases. Annual Review of Pathology: Mechanisms of Disease. (2020) 15(1): p. 211−234.
- Corro C. et al., A brief history of organoids. Am. J. Physiol. (2020) 319: C151−C165
- Gupta, N. et al., Microfluidics-based 3D cell culture models: Utility in novel drug discovery and delivery research. Bioeng Transsl Med, 2016. 1(1): p. 63-81
- Sirenko, O. et al. High-Content Assays for Characterizing the Viability and Morphology of 3D Cancer Spheroid Cultures. Assay and Drug Dev Tech. (2015) 13, 402.
Acknowledgements
This work was done in collaboration with Dr. Oksana Sirenko (Molecular Devices, Inc.)
Pu·MA System Microfluidics
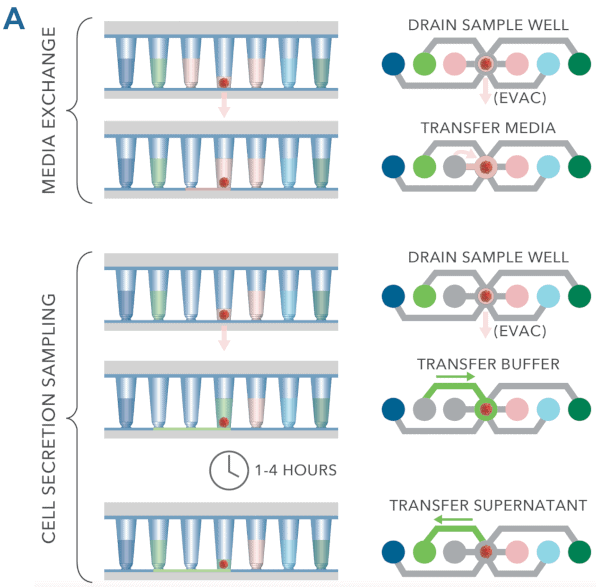
The Pu·MA System can automatically perform complex assay steps using proprietary microfluidics. All reagents are loaded into flowchips and then incubation, media exchanges, cell secretion sampling and other steps are executed by the system program (schematic of fluid transfers is shown in Figure 6A).
The key features are:
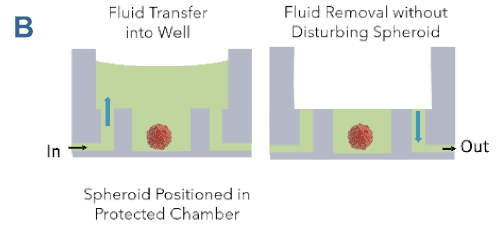
- 3D Cell models remain in the protected sample chamber during the assay (Figure 6B)
- 95% of media can be exchanged without drying cells
- There is no direct fluid flow over cells to disrupt the cell structures
(Figure 6B) - Optically clear bottom allows high resolution imaging
Figure 6. Pu·MA System microfluidics. A Schematic showing typical protocol steps available with the Pu·MA System. All steps are performed automatically inside an incubator. B Schematic of the protected sample chamber and fluid flow.